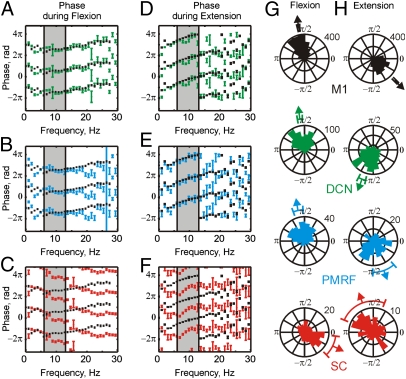
Fig. 2.
Circular mean coherence phase calculated from individual LFP-acceleration phase spectra, averaged over both monkeys during flexion (A–C) and extension (D–F) movements. Average phase (mean ± SEM) was calculated for DCN (green, n = 331), PMRF (blue, n = 179), and SC (red, n = 52) and compared with average M1 phase (black, n = 474). Shaded area shows the 6 to 13 Hz range. (G and H) rose plots of the circular mean phase of each LFP from 6 to 13 Hz during flexion (G) and extension (H). Arrows and bars show mean and 95% confidence limits for all of the recordings within that area. The bin width in rose plots is π/24.

