Fig. 3.
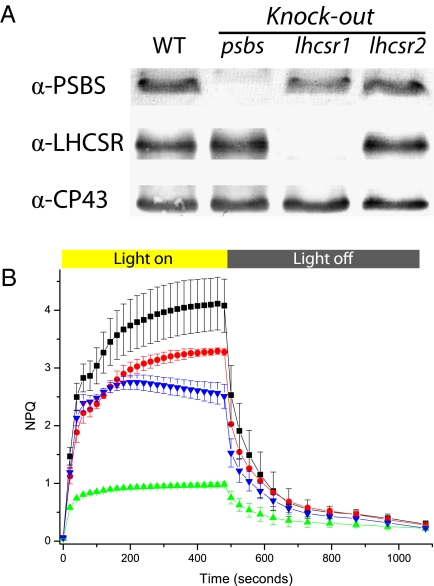
P. patens psbs and lhcsr KO phenotypes. (A) Western blotting using antibodies against LHCSR and PSBS. Western blotting against CP43 is also shown as a loading control. Thylakoids were loaded in all cases, 0.5 μg of Chl for anti-PSBS and 0.3 μg of Chl for all the others. (B) NPQ kinetics of selected lines. Curves for WT and psbs KO, lhcsr1 KO, and lhcsr2 KO are shown in black, blue, green, and red, respectively. Averages and SD are calculated from at least five independent measures.

