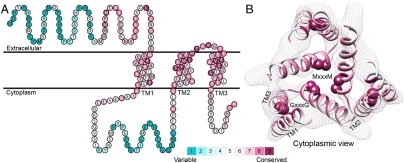
Fig. 1.
Evolutionary conservation profile of the hCTR1 full sequence and TM model. In both panels, the coloring is according to the evolutionary conservation scores calculated via the ConSurf server (34, http://consurf.tau.ac.il), with turquoise-to-maroon signifying variable-to-conserved positions (shown by the color bar). (A) The predicted topology of hCTR1. The three TM segments are marked. (B) Intracellular view of the Cα-trace model of the TM domain hCTR1, fitted onto the cryoEM map (9) (mesh). Residues of the MxxxM and GxxxG motifs are shown as spheres, and the three TM helices are marked on one of the subunits.

