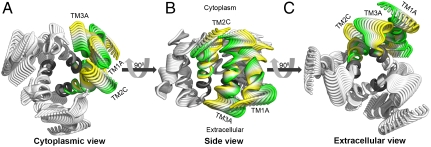
Fig. 4.
The ANM mode matched to GNM mode 1,2 (Table S4 and Movie S1). The conformations predicted by the ANM mode associated with GNM mode 1,2 (Table S4) are colored white, with approximated hinges at the MxxxM motif region in gray. As in GNM mode 1,2, motion was divided into three separate structural elements, each consisting of TM1 and TM3 from the same subunit, along with the N-terminus of TM2 of an adjacent subunit (marked). Conformations of one such structural element are colored according to the direction of motion, ranging from yellow to green and back. (A) Cytoplasmic view. (B) Side view. (C) Extracellular view.

