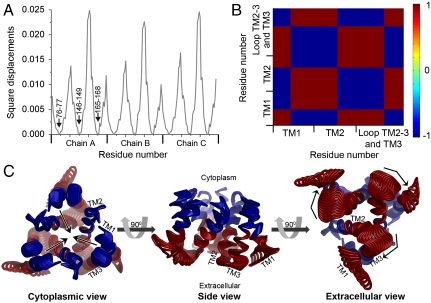
Fig. 5.
Functional and cooperative dynamics of the third GNM and corresponding ANM modes. (A) Square displacements of the third GNM mode; the hinge positions are indicated on chain A. (B) Cooperative dynamics in GNM mode 3, colored as in Fig. 3B. Interresidue correlations are shown on one subunit only; the same correlations were obtained for the other two. The boundaries of the TM helices are marked. The cytoplasmic and the extracellular regions of the helices show opposite correlations. (C) The corresponding ANM mode (Table S4, Movie S2, and Movie S3). The conformations are colored according to the cooperative dynamics of GNM mode 3 and shown in three different views. The arrows mark the directions of the motions of the cytoplasmic (blue) and extracellular (red) helix regions.

