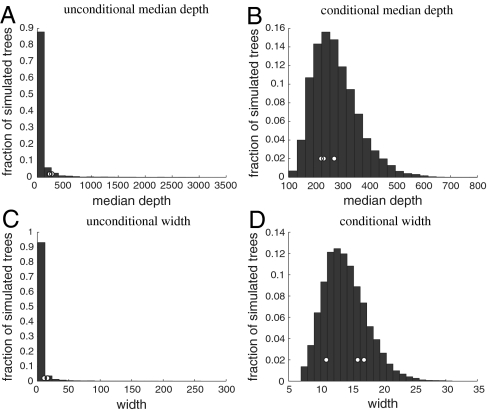
Fig. 1.
Histograms of unconditional and conditional statistics from the simulated trees. (A) and (B) Median node depths. (C) and (D) Tree widths. The figures on the left, (A and C), correspond to the unconditional distribution, whereas the right ones, (B and D), come from the distribution conditional on the bounds on the number of nodes. The white circles correspond to the three observed components of the NPR chain letter data.

