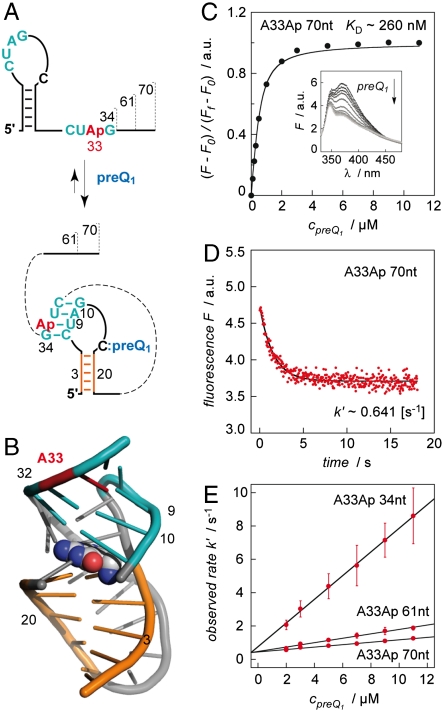
Fig. 4.
Kinetic assessment of ligand-induced preQ1 riboswitch folding. (A) Schematics of secondary structure rearrangement of A33Ap labeled variants (34 nt, 61 nt, 70 nt). (B) Location of A33Ap (red) in the aptamer/preQ1 complex (coordinates based on the crystal structure from Ferre d’Amaré and coworkers of a homologous preQ1 aptamer from B. subtilis (13); representation of RNA in cartoon and of ligand (preQ1) in spheres. (C) Determination of apparent KD value. Fluorescence changes upon titration of A33Ap 70 nt labeled variant with preQ1. Normalized Ap fluorescence intensity plotted as a function of preQ1 concentrations. Changes in fluorescence (F-F0) were normalized to the maximum fluorescence measured in the absence of preQ1. The graph shows the best fit to a single-site binding model (SI Text). The inset shows fluorescence emission spectra (λex = 308 nm) from 330–480 nm for each preQ1 concentration; cRNA = 0.5 μM, 50 mM KMOPS, 100 mM KCl, 2 mM MgCl2, pH 7.0, at 298 K. (D) Representative fluorescence response of the A33Ap 70 nt variant upon preQ1 addition; conditions: same as (C) and cpreQ1 = 2.0 μM; mixing was performed with a stopped-flow apparatus. (E) Plot of observed rate k′ versus ligand concentration for the three different A33Ap variants as indicated. Observed rates were determined under pseudo-first-order conditions from three independent stopped-flow measurements. The slope of the plot yields the rate constant k (see Table 1).

