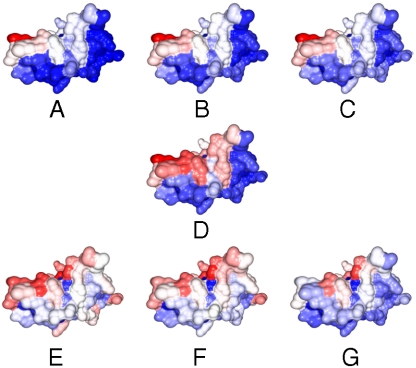
Fig. 2.
The surface of T-cell receptor protein CD8 (PDB ID code 1akj, chain D) colored according to the frequency with which interactions made by its structural neighbors are mapped to individual residues on its surface (red/white/blue = high/intermediate/low frequency). Each surface is colored based on a different set of structural neighbors: (A) SCOP family b.1.1.1; (B) superfamily b.1.1; (C) fold b.1; (D) PSD < 0.6 (found by Ska); (E) PSD < 0.6 in different families; (F) PSD < 0.6 in different superfamilies; (G) PSD < 0.6 in different folds. The red high contacting frequency regions show conserved protein interface.

