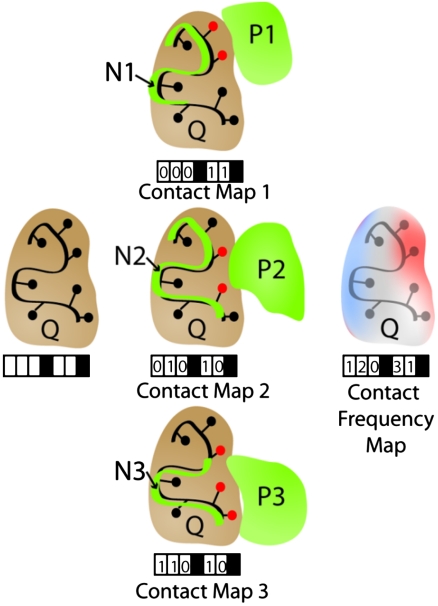
Fig. 4.
Calculating the contact map and contact frequency map. In the above example, a given query protein (Q, brown) with seven residues has five residues on the surface. Structural neighbors (Ni, green lines) involved in protein complexes are superimposed on Q, and the same transformation is applied to their interacting partners (Pi, green surfaces). Whenever a heavy atom from a residue of Pi is  of an atom of a surface residue of Q after applying the transformation, that residue is marked (red circles), generating a contact map for each structural neighbor (black boxes represent nonsurface residues that are not included). The “contact frequency map” is generated by summing the individual contact maps.

