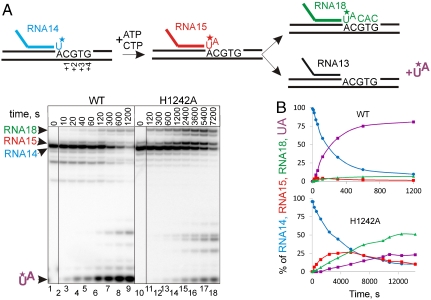
Fig. 3.
Impact of TL catalyzed hydrolysis on the proofreading of transcription. (A) The scheme above the gels shows the experimental setup. RNA in the elongation complex (EC2 in Fig. S1) is labeled at the 3′ end by incorporation of [α32P]UTP (asterisk in the scheme). The 3′ end labeling of RNA enables the monitoring of misincorporation, readthrough, and proofreading simultaneously. Misincorporation of 1 mM ATP, readthrough in the presence of 100 μM CTP, and proofreading (cleavage of pUpA) by WT and H1242A RNAPs are shown. The cleavage products, migrating slower than a dinucleotide, originate from hydrolytic cleavage in readthrough complexes (with RNA longer than 15 nucleotides) after backtracking (see Fig. 4 and Fig. S3) (30). Products are designated in colors the same as those used in the scheme of the reaction shown above the gels. A black vertical line separates lanes originating from the same gel that were brought together. (B) Graphic representation of the data from A. The color code for the plots is the same as in A.

