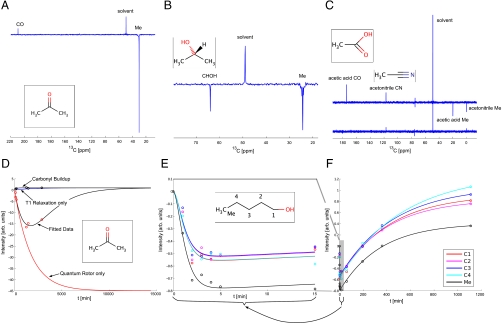
Fig. 1.
Time evolution of quantum rotor polarization. (A) 1H decoupled 13C spectrum of acetone following a 20 h cooling period at 1.4 K to build up QR polarization for the methyl group (Me) followed by dissolution and transfer to a 11.75 T magnet. The carbonyl (CO) signal is much weaker when the maximum of QR polarization has been reached and has an opposite sign. (B) 1H decoupled 13C spectrum of isopropanol showing transfer of polarization via the proton network after 60 min at 1.4 K, specifically from the methyl protons (Me) to the H2 proton. Subsequent cross-relaxation generates observable 13C magnetization. (C) (Bottom) 13C spectrum of acetonitrile after 60 min at 1.4 K. (Top) Same spectrum for a mixture of acetonitrle and acetic acid. (D) Experimental and fitted QR polarization buildup curve for pure acetone. (Red Circles) Experimental signal intensities for the methyl group. (Black Circles) Signal intensities for CO. (Black Lines) Fitted data according to Eq. 6 for the methyl carbon and to a saturation recovery curve for CO. (Red Line) Simulated QR buildup curve using values obtained from the experimental data. (Blue Curve) Simulated Boltzmann buildup for the methyl 13C neglecting the quantum rotor contribution. (E, F) Different time frames for experimental and fitted curves for the QR buildup of pentanol. E focuses on the first 15 min, whereas F shows the time course over 20 h. Black, experimental data and simulated curve for CH3; C1, C2, C3, and C4 in red, magenta, blue, and cyan, respectively.

