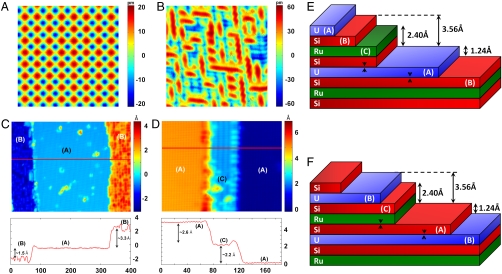
Fig. 1.
STM topography. (A and B) Constant current topographic image (-200 mV, 60 pA, 33 Å) showing an atomically ordered surface (termed surface A) and (100 mV, 200 pA, 90 Å) showing an atomic layer with surface reconstruction (termed surface B), respectively. (C) The relative heights between surfaces A and B. (D) Constant current topographic image (-50 mV, 100 pA) over a 185 × 140 Å2 area showing a (2 × 1) reconstructed surface (surface C) lying ∼2.2 Å above surface A. A horizontal line cut through the data in C and D is shown on the bottom panels. (E) Schematic diagram illustrating the different atomic layers of URu2Si2. U is identified as the atomically ordered surface (surface A) that lies 1.24 Å above and 3.56 Å below surface B. In this case, obtaining surfaces A and B requires breaking of a single bond only (U-Si; see arrows). (F) Schematic diagram illustrating a different possibility for the cleaved surfaces, which requires the breaking of two bonds (Ru-Si and U-Si; see arrows). This scenario cannot explain why surfaces A and B occur with roughly equal probabilities. The step heights in A and B are obtained (or calculated) from ref. 6.

