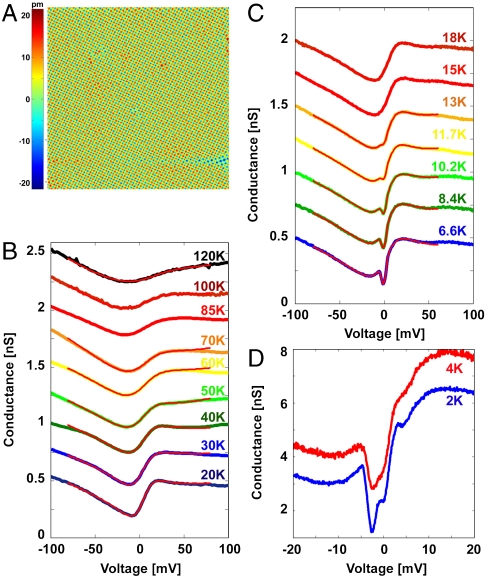
Fig. 2.
STM topography and spectroscopy on URu2Si2. (A) Constant current topographic image (-200 mV, 60 pA) over a 200-Å area showing the atomically ordered surface where the spectroscopic measurements are performed. (B and C) Averaged electronic DOS above (B) and below (C) the HO temperature. The red lines in B and C are the results of least squares fit described in the text and SI Text. Spectra are offset by 0.25 nS for clarity. (D) Averaged electronic DOS at low temperatures showing additional features within the gap. Spectra are offset by 1 nS for clarity.

