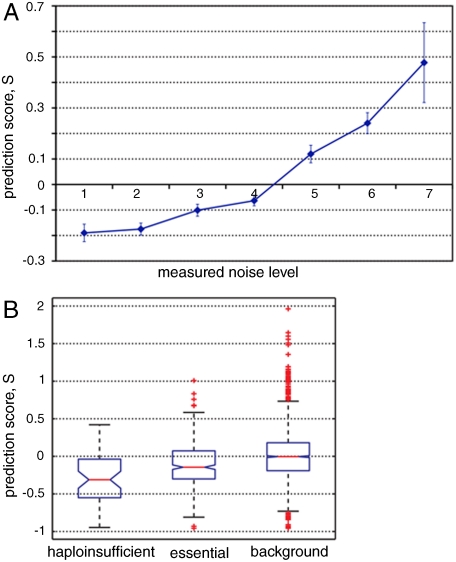
Fig. 3.
(A) Consistency between the prediction score and the actually measured noise in the blind test. Greater scores indicate higher expression fluctuation. Error bars represent one standard error. (B) Box plots of prediction scores (S). It is clear that expression noise of the haploinsufficient and essential genes have reduced expression noise compared with the genome background, and the haploinsufficient genes have lower expression noise than the essential genes. All pairwise comparisons are statistically significant.

