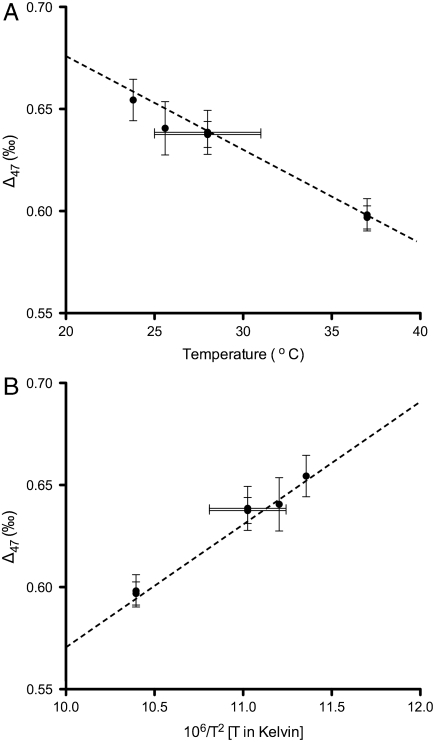
Fig. 1.
The relationship between measured Δ47 values from bioapatite and the body temperature of the organism. The Y-value for each data point represents the mean Δ47 value derived from 3–7 measurements of distinct extractions of CO2 from tooth bioapatite. Y-axis error bars represent the external precision of the measurement, to one standard error. The X-axis scale shows the predicted body temperature of each species, based on previous studies on their thermoregulation, as described in detail in the main text. X-axis error bars represent uncertainties in body temperatures. (A) Δ47 data plotted against temperature, reported in °C. (B) The same data plotted as 106/T2 [T in Kelvin]. The inorganic calcite calibration derived by Ghosh et al. is plotted as a dotted line (31). Δ47 measurements of CO2 extracted from bioapatite all fall within one standard error of the inorganic calcite line.

