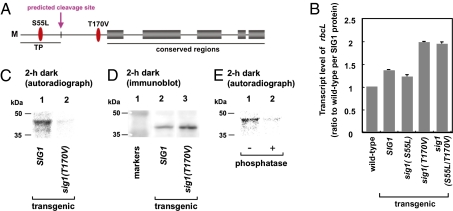
Fig. 1.
Effects of Ser/Thr phosphorylation of SIG1 on the transcript level of a chloroplast gene. (A) Predicted Ser/Thr phosphorylation sites in Arabidopsis SIG1. (B) Levels of rbcL transcripts in wild-type plants and transgenic lines sig1(S55L), sig1(T170V), and sig1(S55L/T170V) when adapted to the dark for 1 wk. Levels determined by quantitative RT-PCR were standardized by using ACT2 transcripts and were further normalized by the content of SIG1 protein determined by immunoblotting. Vertical bars at the top of histograms represent the SDs of three independent experiments. (C–E) Phosphorylation of SIG1 and sig1(T170V). (C) Plants (3-wk-old) were incubated with [32P]orthophosphate in the dark. Immunoprecipitates with anti-SIG1 were fractionated by SDS/PAGE, and radioactivity on the dried gel was detected with Storm 820 (Amersham Biosciences). (D) Immunoblotting of extracts shown in C with anti-SIG1. (E) Extracts from SIG1-transgenic plants labeled with 32P in the dark were prepared without phosphatase inhibitors only for this experiment and were immunoprecipitated with anti-SIG1. The immunoprecipitates were incubated with or without 25 units of calf intestinal alkaline phosphatase for 30 min, followed by SDS/PAGE and autoradiography.

