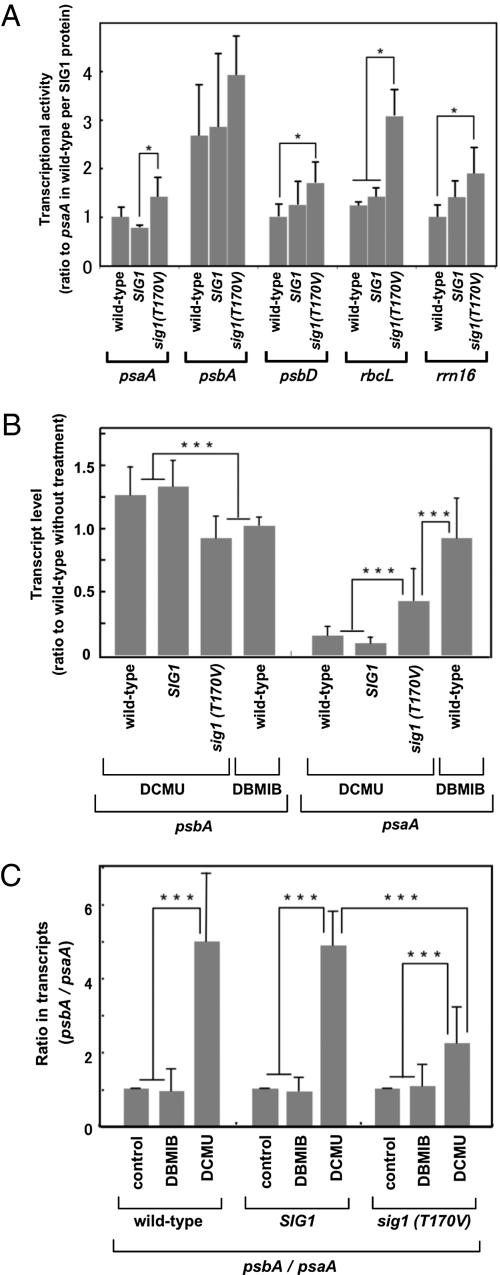
Fig. 2.
Effects of phosphorylation of SIG1 on the run-on transcription and transcript levels of genes for PS-II (psbA) and PS-I (psaA) at different states of PQ. (A) Run-on transcription of chloroplast genes. Transcriptional activity for each gene is shown as the fraction of that of the wild-type after standardization with the SIG1 content determined by immunoblotting. Error bars represent the variations of three independent experiments. Asterisks indicate statistically significant differences (P < 0.05). (B and C) Transcript levels in plants were determined by real-time RT-PCR. The redox status of PQ was manipulated with the inhibitors DCMU and DBMIB. (B) Ratios of transcript levels of each gene in the treated transgenic lines to those in the untreated wild-type. (C) Ratio of transcripts of psbA to psaA in each plant. “Control” means the plants were not treated. Error bars represent the variation of three independent experiments. Triple asterisks indicate statistically significant differences (P < 0.01).

