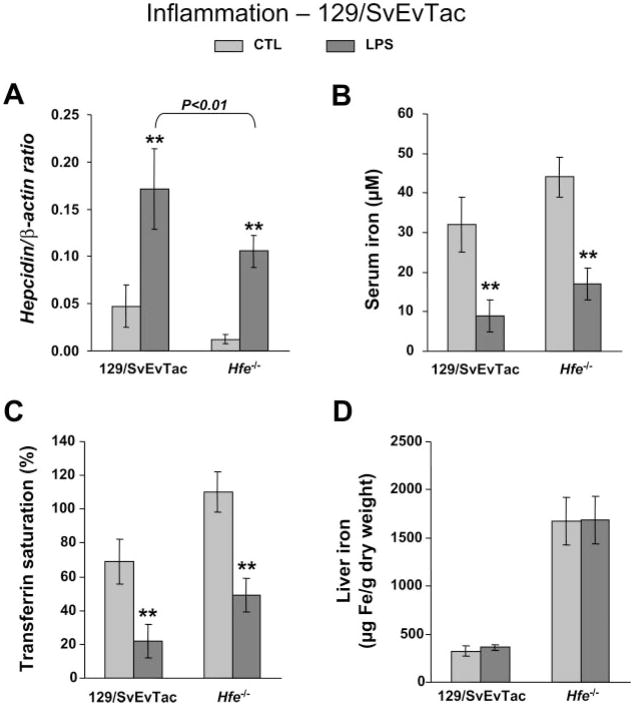
Fig. 4.
Hypoferremia and hepcidin induction by inflammation in Hfe-deficient mice from the 129/SvEvTac background. Hepcidin gene expression (A), serum iron (B), transferrin saturation (C), and iron concentration in the liver (D) in saline-treated control mice (CTL; light gray) and LPS-treated mice (dark gray). Hepcidin mRNA expression was quantified by qRT-PCR and normalized to β-actin. The hepcidin/β-actin ratio is shown. The results are presented as means ± SD (n = 6 mice/group). Statistical analysis was performed by 1-way ANOVA; **P < 0.001 for comparison with respective control mice.

