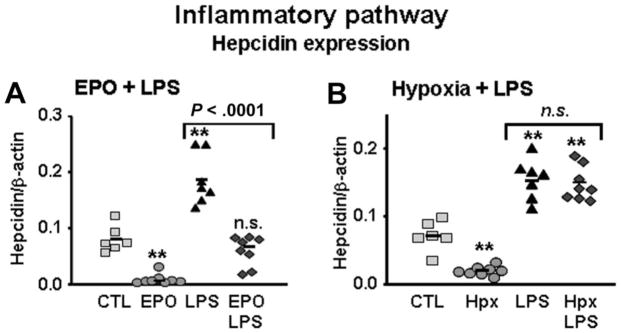
Figure 2. Erythropoietin but not hypoxia inhibits hepcidin induction through the inflammatory pathway.
(A) Hepcidin mRNA levels in the liver of mice treated with saline (control [CTL]), EPO, LPS, and mice with combined treatments (EPO + LPS). (B) Hepcidin mRNA levels in the liver of mice treated with saline (CTL), mice subjected to 10% oxygen (hypoxia [Hpx]), LPS, and mice with combined treatments (Hpx + LPS). Hepatic hepcidin expression was quantified by real-time RT-PCR and normalized to β-actin. The hepcidin/β-actin ratios are shown, each symbol representing 1 mouse. Statistical analysis was performed by 1-way ANOVA; **P < .001 for comparison with control mice. n.s. indicates not significant.

