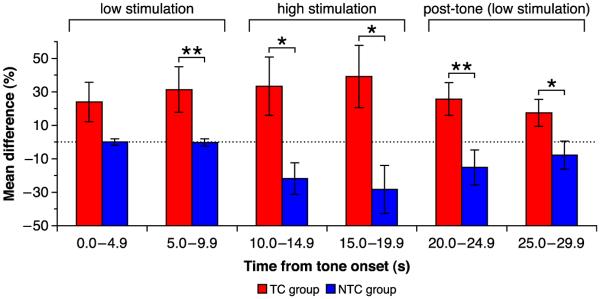
Fig. 3.
Average group performance of TC and NTC groups (percent difference from pre-tone baseline). Nose poke (NP) rate was calculated in consecutive 5 s periods from 10 s before tone onset to 10 s after tone offset. The 10 s before the tone constituted the pre-tone baseline. During the first 10 s after tone onset, the subjects received low train duration stimulation in response to NPs. For the last 10 s of the tone, the subjects received high train duration stimulation. After the tone, the stimulation returned to the low train duration. The TC group showed a significant increase in NP rate relative to the NTC group during the second 5 s after tone onset, and thereafter. *p ≤ .05, **p ≤ .01.

