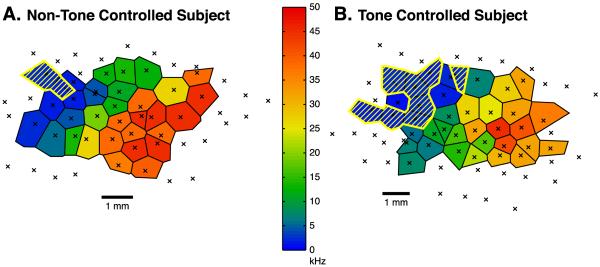
Fig. 5.
Tonotopic maps (Voronoi tessellations) in the primary auditory cortex showing the organization of characteristic frequencies (CFs) for representative subjects within the NTC and TC groups. Recording sites are marked by crosses. Polygons outline the areas representing the CFs, with the color representing the frequency as denoted by the color bar. Regions indicated by yellow hatch lines denote the representational areas for CFs within the 2.0 kHz CS tone ± 0.25 octave band (half-octave = 1.682–2.378 kHz). Crosses not surrounded by colored polygons represent sites classified as outside of A1. Scale bar = 1 mm. (A) Example of a NTC subject; the representational area of CFs within the 2.0 kHz half-octave band was 5.8% of the primary auditory cortex. (B) Example of a TC subject; note the larger representational area for the CS half-octave band, which was 22.6% of the total area of A1.

