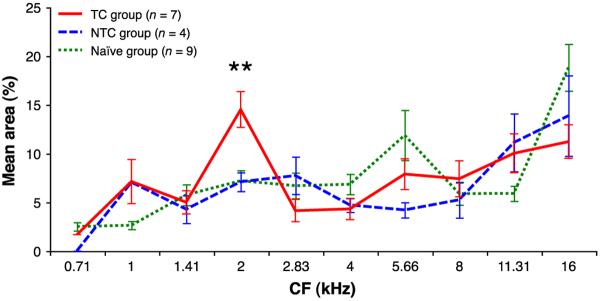
Fig. 6.
Mean percent area of representation of half-octave frequency bands for TC, NTC and Naïve groups. For clarity, only data for the lowest 10 bands are shown. The TC group showed a significant increase in percent area represented at the 2.0 kHz half-octave band compared to the NTC and Naïve groups. There were no other significant differences. **TC vs. NTC, p = .0140; TC vs. Naïve, p = .0026.

