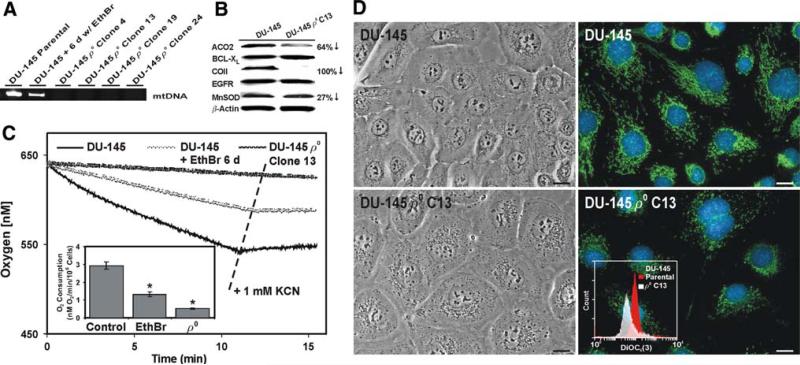
Fig. 5.
Characterization of the DU-145 ρ0 cells. a DU-145 cells were exposed to medium containing 100 ng/ml EthBr for 6 days or 8 weeks and examined for mtDNA sequences using a PCR assay. b Immunoblot examination of protein levels in the parental DU-145 cells and the DU-145 ρ0 clone 13. The antibodies included mitochondrial aconitase (ACO2), BCL-XL, cytochrome c oxidase subunit II (COII), epidermal growth factor receptor (EGFR), Mn superoxide dismutase (MnSOD), and the loading control β-actin. The band intensity and relative protein levels were determined as described in Fig. 2b. c Plots of O2 consumption in the parental DU-145 cells, DU-145 cells cultured for 6 days in medium containing EthBr, or the DU-145 ρ0 clone 13 cells. Where indicated, KCN (a final concentration of 1 mM) was added directly to the respiration chamber using a syringe. The O2 consumption results depicted in the inset graph were normalized for 106 cells and expressed as the mean of triplicate samples for each treatment ± SD (error bars) (* P < 0.01 compared to the parental DU-145 cells). d The parental DU-145 cells and the DU-145 ρ0 clone 13 cells were imaged using light and epifluorescence microscopy. For the epifluorescence images, the cells were stained as described in Fig. 3a. The scale bars equal 18 μm. The inset graph shows the DiOC6(3) staining for 2 × 10⁶ DU-145 and the DU-145 ρ0 clone 13 cells analyzed via flow cytometry as described in Fig. 1d

