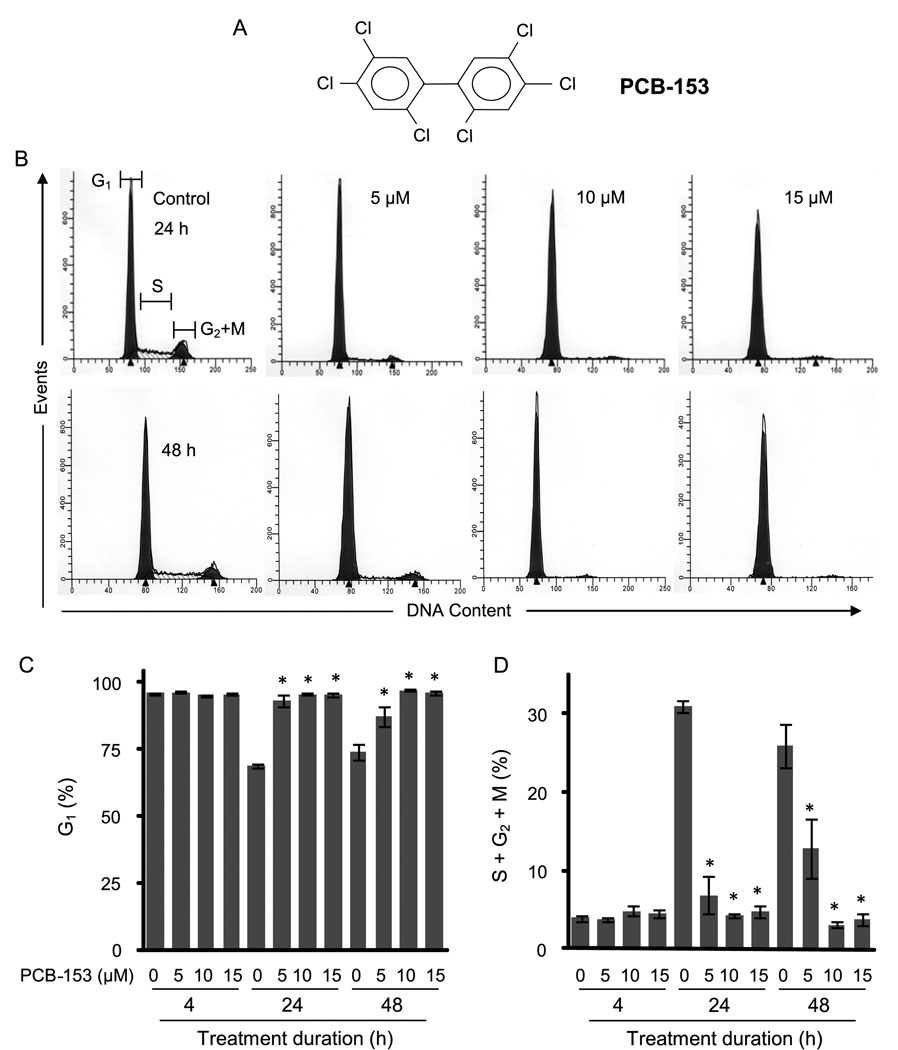
Fig. 1. PCB-153 treatments inhibited entry into S-phase.
MCF-10A non-tumorigenic human mammary epithelial cells were incubated with PCB-153 for the indicated times. Cells were harvested for flow cytometry measurements of DNA content. (A) Chemical structure of PCB-153 (2,2',4,4',5,5'-hexachlorobiphenyl); (B) Representative DNA histograms at the end of 4, 24 and 48 h of PCB-153 treatments; the percentages of G1 (C) and S+G2+M (D) were calculated using Cell-Quest software. The percentage of cells in G1 and S+G2+M phases is expressed as the mean of three independent experiments run in duplicate. ANOVA followed by Tukey’s post hoc test were used to assess statistical significance of results. Asterisks represent significant difference between control and treated samples (n=3, p < 0.05).

