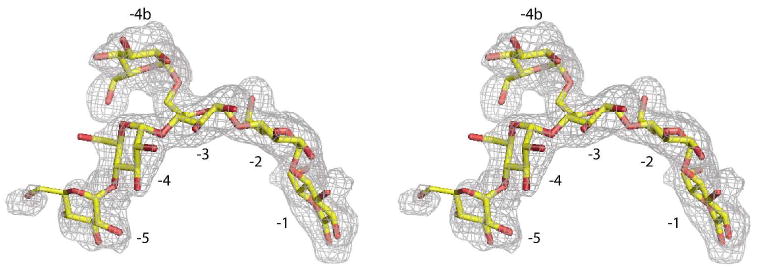
Figure 3.

Stereoview of the limit dextrin superimposed on difference density generated from structure factors and phases calculated from the final model with the limit dextrin omitted. Subsites are numbered; the density is contoured at 2.5σ for subsites −1 through −4 and contoured at 1.5σ for subsites −5 and −4b.
