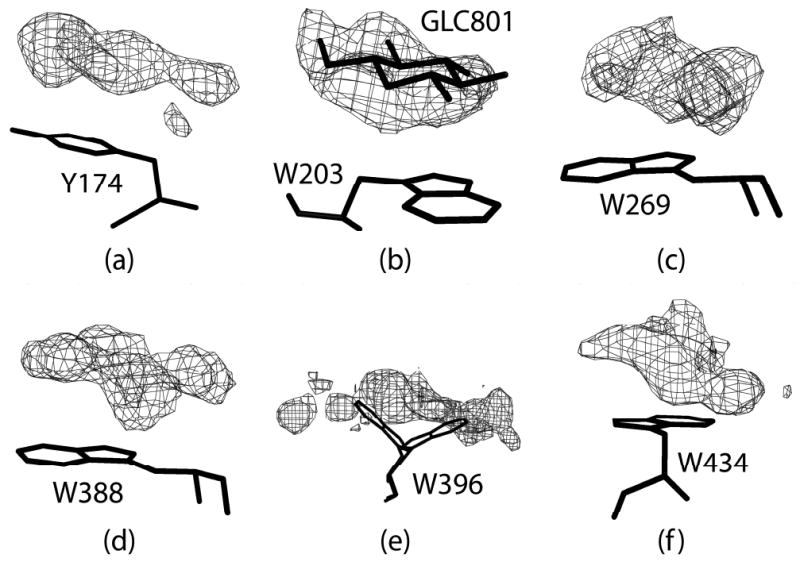
Figure 9.

Additional or potentially additional carbohydrate surface binding sites. Electron difference density was calculated from the phases and structure factors using the final model for parts (b), (c), (e), and (f). For parts (a) and (d) water molecules in the vicinity of the density were remove from the final model before the map calculation. The density in parts (a), (b), (c), (e) and (f) are contoured at 2.0σ; in part (d) it is contoured at 2.5σ.
