
Figure 6.
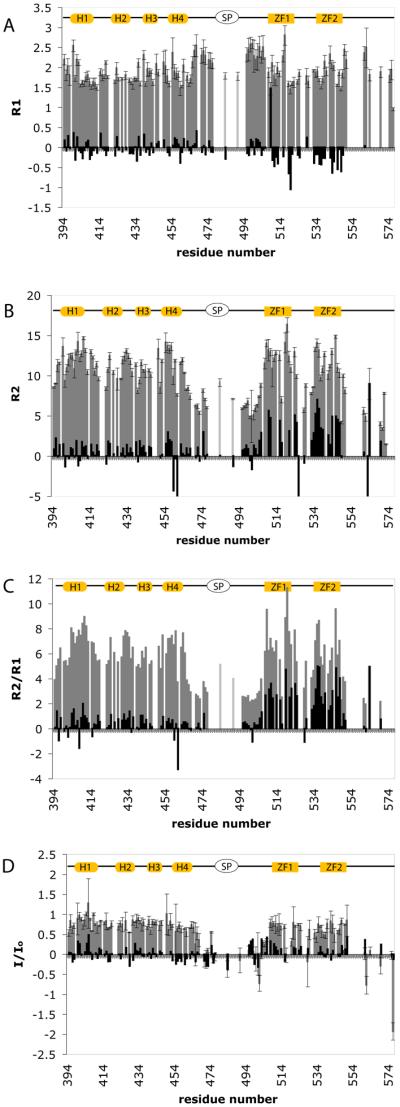
15N relaxation data at 600 MHz for RSV CTD-SP-NC in the bound form (gray bars) and the difference equal to bound minus unbound values (black bars). A. Longitudinal relaxation rates, R1. B. Transverse relaxation rates R2. C. R2/R1 ratio. D. 1H-15N I/I0 values. Structural elements drawn at the top are as in Figure 3. Except for Q484 and V491, residues 479-493 in SP and N-terminus of NC, colored light gray in Figure 3, are exchange broadened and not detected.