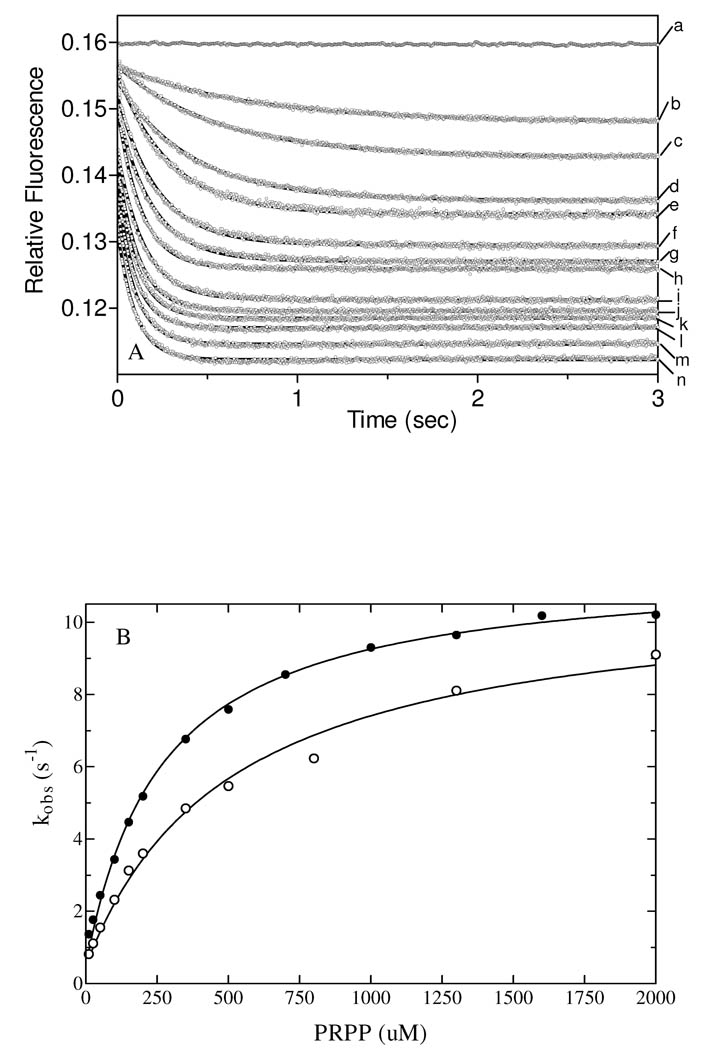
Figure 6.
Stopped-flow studies with WT and E214Q QAPRTases. (A) Reaction traces obtained from Stopped-flow fluorescence analysis. Time dependence decay of intrinsic WT QAPRTase fluorescence upon mixing the QAPRTase•QA complex (6 µM QAPRTase incubated with 300 µM QA) with various concentrations of PRPP at pH 7.2, 25 °C (λex = 290 nm, λem = 340 nm). Final PRPP concentrations were (a) 0, (b) 10, (c) 25, (d) 50, (e) 100, (f) 150, (g) 200, (h) 500, (i) 350, (j) 700, (k) 1000, (l) 1300, (m) 1600 and (n) 2000 µM. The traces were fit to a single exponential decay function (eq I). (B) Dependence of the observed rate constants of data from Figure A on PRPP concentration for WT (●) and E214Q (○).

