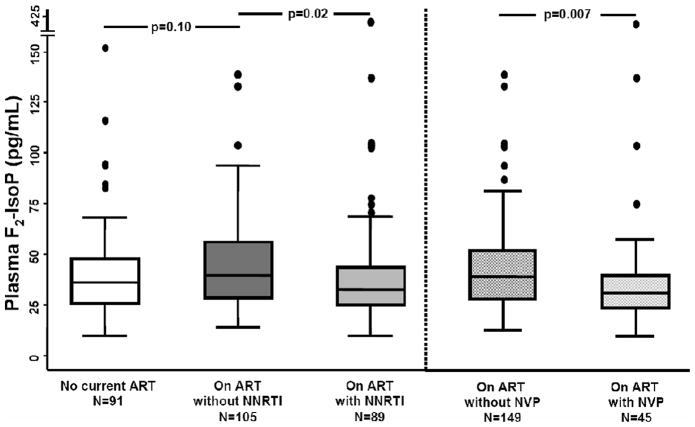
Figure 1.
Box plots of plasma F2-isoprostanes (F2-IsoP) in study participants receiving no antiretroviral therapy (ART; white box), receiving ART without a non-nucleoside reverse transcriptase inhibitor (NNRTI; dark grey shaded boxes), receiving ART with an NNRTI (light grey shaded boxes), and receiving ART that did not include nevirapine (NVP) and receiving ART that included NVP (shaded cross-hatched boxes). Horizontal lines represent median, interquartile range, and 5th and 95th percentile values. Outliers are shown by individual markers. P values shown are from unadjusted pair-wise Mann-Whitney U tests. The Kruskal-Wallis p value for comparison of first three groups = .05. Sample sizes for each group are shown.

