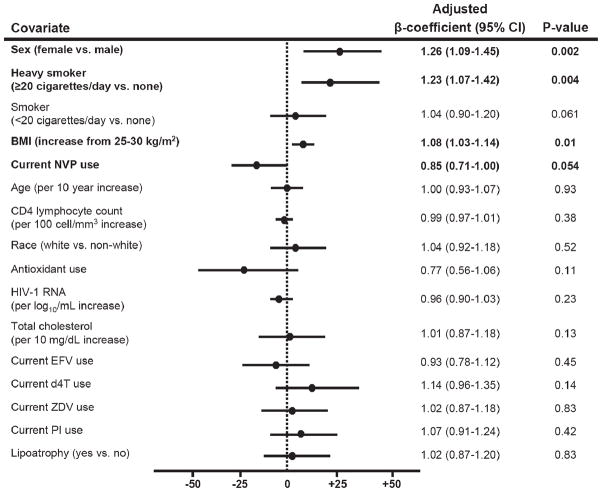
Figure 2.
Plots of adjusted β-coefficient values from multivariate linear regression modeling shown as percent change in F2-IsoP for a unit change in covariate. As body mass index (BMI) was included in the model as a nonlinear effect using restricted cubic spline, the β-coefficient shown for BMI corresponds to percent change in F2-IsoP as BMI increase from 25 to 30 kg/m2. Missing values for BMI (n = 4), total cholesterol (n = 5), HIV-1 RNA (n = 8), and CD4 lymphocyte count (n = 9) were imputed using multiple imputation methods.27 ART = antiretroviral therapy; CI = confidence interval; NNRTI = non-nucleoside reverse transcriptase inhibitor; F2-IsoP = F2-isoprostanes; NVP = nevirapine; EFV = efavirenz; d4T = stavudine; ZDV = zidovudine; PI = protease inhibitor.

