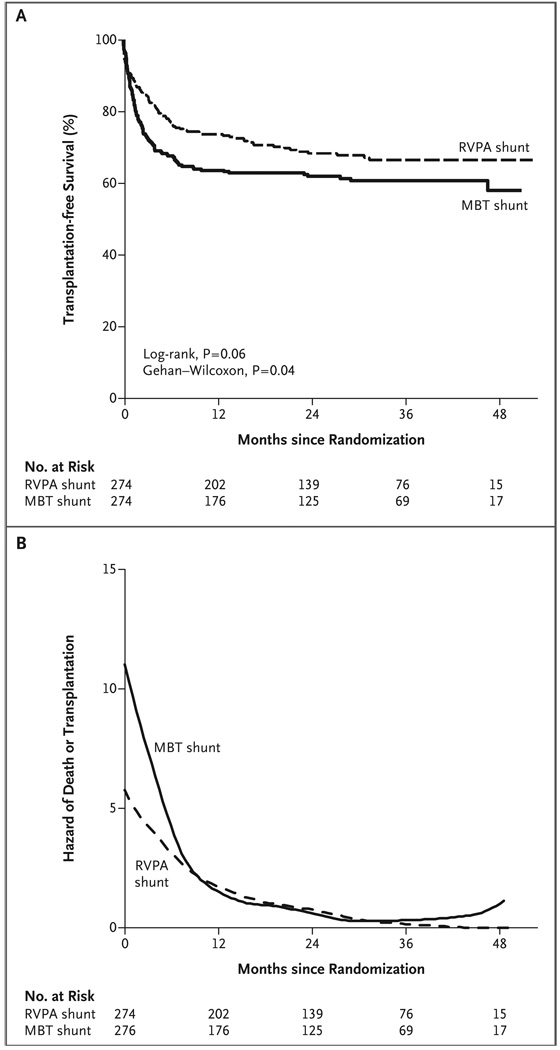
Figure 4. Primary Outcome and the Hazard of Death or Transplantation at 12 Months, According to Shunt Assignment.
Panel A shows the Kaplan–Meier curves for transplantation-free survival among all infants who underwent the Norwood procedure, according to the intention-to-treat analysis. Panel B shows the estimated hazard of death or transplantation among all infants who underwent the Norwood procedure, according to the assigned shunt. The hazard is an instantaneous rate representing the predicted number of deaths or transplantations per month at a defined time point. P = 0.02 for the difference in the treatment effect for the period before and the period after 12 months. MBT denotes modified Blalock–Taussig, and RVPA right ventricle–pulmonary artery.

