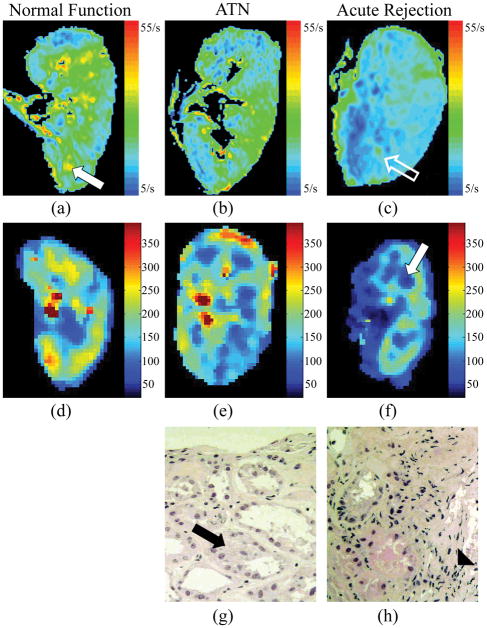
Fig. 1.
In the R2* color map of a normal functioning transplanted kidney (a) there are green, yellow and orange areas in the medullary pyramids (white solid arrow). In a transplanted kidney with acute rejection, the R2* color map demonstrates more blue areas (c), particularly in the region of the medullary pyramids (open white arrow) that corresponds to lower R2* values in the medulla (c). On perfusion color maps, there are darker blue and black areas in the medulla of transplanted kidneys with acute rejection (white solid arrow), corresponding to lower perfusion values (Fig. 1f). On histopathological evaluation there is cellular debris (black arrow) in the tubules and relative preservation of the capillaries in the specimen from allografts with ATN (Fig. 1g). The specimens from allografts with acute rejection demonstrate polymorphonuclear cell infiltration (solid arrowhead) and swelling of the tubular cells and vessels (Fig. 1h).

