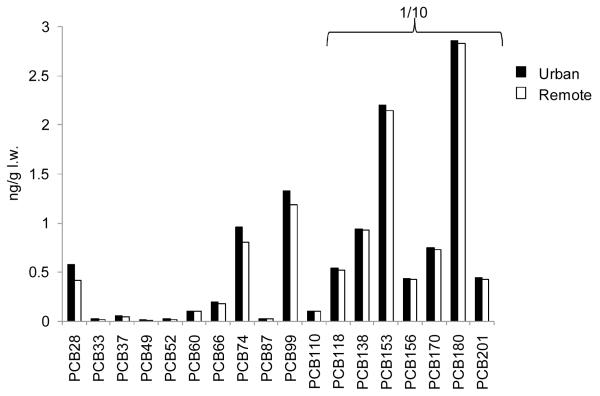
Figure 2.
Predicted PCB concentrations in a 56 year old man exposed to PCBs via the diet and via inhalation of air from an urban (Chicago) and a remote area (Sleeping Bear Dunes). The dietary exposure was the same in both simulations and represented background exposure for this region. The concentrations of PCB 118 to PCB 201 have been divided by ten. l.w. = lipid weight.

