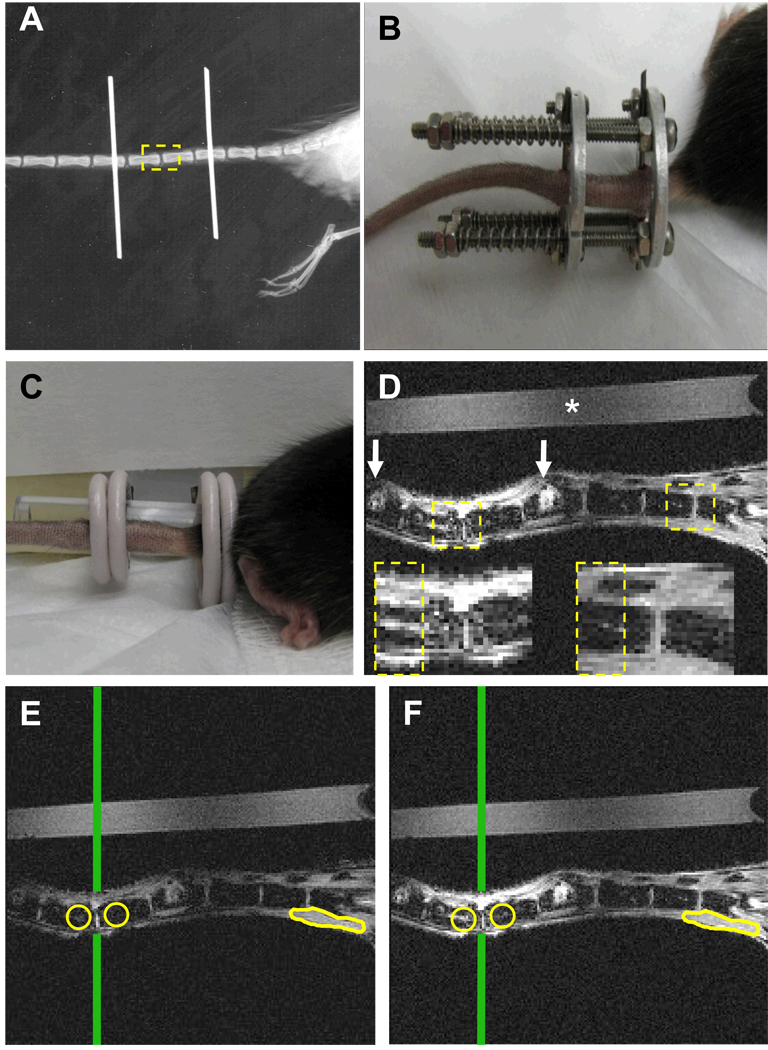
Figure 1. Quantification of chronic load-induced bone marrow edema in vertebral endplates of the mouse tail.
(A) Plain x-ray of a mouse tail that has been instrumented with Ti pins transcutaneously in the center of the 7th and 10th caudal vertebrae. The 8th and 9th caudal vertebrae are highlighted as the ROI (dashed box), as they bear the chronic load in this model, but are not affected by instrumentation. (B) A photograph of a fully instrumented and loaded mouse tail is presented to illustrate the positioning of the external fixator device and calibrated springs. (C) This device is removed prior to MRI scanning, and photograph of the uninstrumented tail is presented to illustrate the placement of the saline phantom and the 2 surface coils for CE-MRI. (D) A representative CE-MRI image taken 3 minutes after injection of the Gd-DTPA contrast agent is shown to illustrate the resolution of this system (* indicates the saline phantom; white arrows indicate the pin insertion sites). Boxes indicate the ROIs used to quantify BME, and are also shown at greater magnification. Note the increase in signal intensity that can be seen in marrow cavity indicating BME formation. Representative pre-contrast (E) and post-contrast (F) MR images obtained after 8 weeks of compression are presented to illustrate how NBMI and NMCE are calculated. Circles indicate regions of interest chosen in the marrow space beneath the endplate of each vertebra. Vertical line indicates the center of the RF coil, determined by the highest signal intensity in the saline phantom, used to normalize day to day variations in coil placement. Muscle tissue outlined at the base of the tail is used to normalize contrast enhancement calculations.

