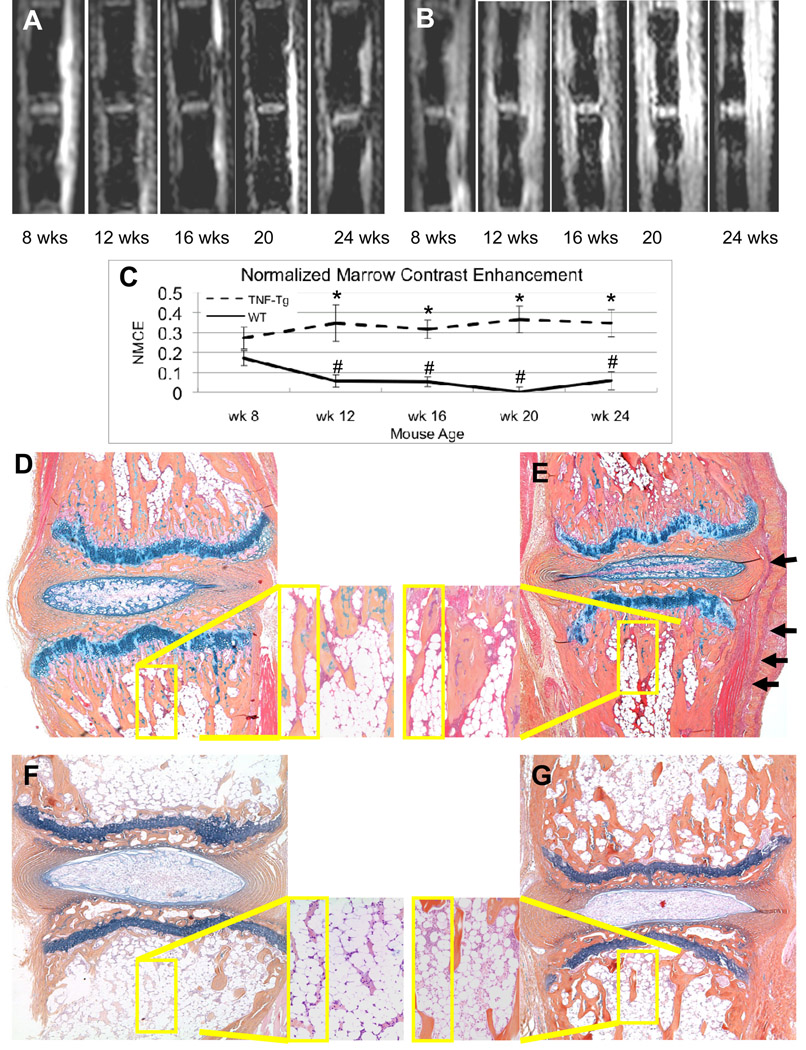
Figure 2. Age related marrow changes in WT and TNF-Tg caudal vertebrae assessed by CE-MRI and histology.
Representative post-contrast images of a uninstrumented WT (A) and TNF-Tg mouse (B) at the indicated age are shown to illustrate the baseline signal intensities of the WT mice versus the increased signal intensities in the bone marrow and surrounding soft tissues seen in the TNF-Tg mice. (C) The NMCE values from the mice at indicated age were quantified, and the data are presented as the mean +/− SD for each group (n=3 tails; 6 vertebrae) (*p<0.05 vs. WT at same time point; # p<0.05 vs. WT at 8-weeks) mice were 8weeks old at week 0 and sacrificed at 16 weeks of age. AB/OG stained histology of caudal vertebrae from a representative 8-week old WT (D) and TNF-Tg (E) mouse are shown at 10X magnification with (40X inset) to illustrate the similar amount of red marrow in both strains at this age (Note inflammatory infiltrate in TNF-Tg, shown by arrows). Histology from 24-week old mice confirms the red to yellow marrow conversion in WT (F), which corresponds to the significant decrease in NMCE, while the persistent red marrow and synovitis observed in the TNF-Tg (G), corresponds to the increased NMCE in the bone and surrounding soft tissue.

