Figure 1.

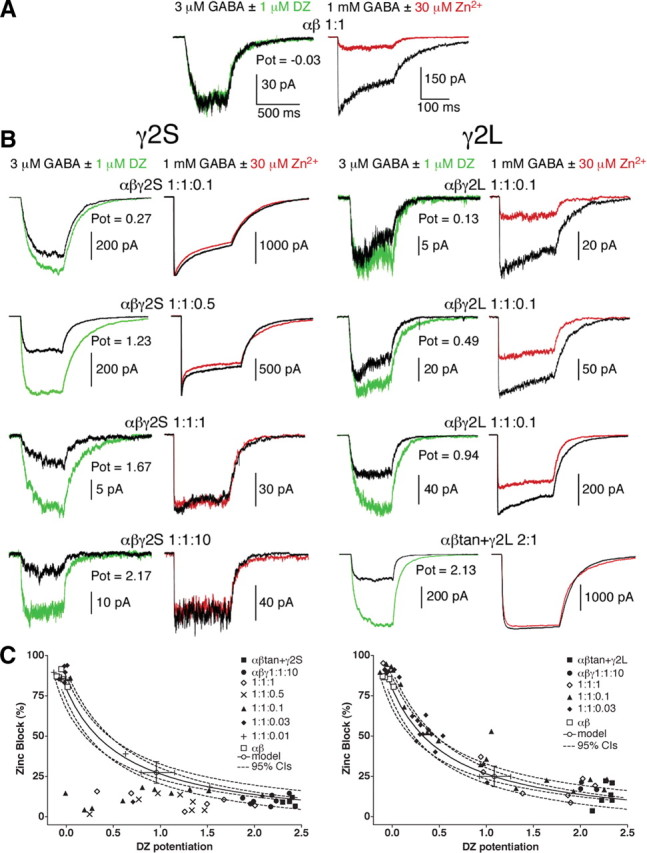
Diazepam potentiation and Zn2+ block for varying γ2S or γ2L transfection ratios. A, HEK293 cells expressing α1 plus β2 subunits. Left, Current traces from 500 ms, 3 μm GABA pulses (black) are superimposed with currents from the same outside-out patch exposed to a coapplication of 3 μm GABA plus 1 μm DZ (green) after equilibration in control solution plus 1 μm DZ. Potentiation (Pot) is reported as (IGABA + DZ/IGABA) − 1. Right, In the same patch, near-maximal current is elicited by 200 ms, 1 mm GABA pulses (black) and blocked by coapplication of 30 μm ZnCl2 (red). Note that α1β2 receptors display significant Zn2+ block but no appreciable DZ potentiation. B, Traces for cells expressing α1 + β2 + γ2S (left) or γ2L (right) at indicated ratios. Note that three γ2L patches are shown from 1:1:0.1 ratio transfections to exhibit variability. Also included are traces for the α1β2γ2L receptors constrained by use of α1–β2 tandem receptors cotransfected with γ2L at a 2:1 ratio. Note that these receptors show similar high potentiation by DZ, minimal blockade by Zn2+, and minimal desensitization in 200 ms pulses (right) at 1 mm GABA, similar to α1β2γ2S receptors constrained by transfection at a 1:1:10 ratio. C, Paired Zn2+ block plotted against DZ potentiation for transfection ratios ranging from 1:1:0.01 to 1:1:10 for α1β2γ2, as well as tandem-constrained αβtan+γ (Boileau et al., 2005) and α1β2. Note that αβ receptors (open squares) show high zinc sensitivity and no potentiation, as do some of the patches from transfections with very low γ2 ratios, indicative of no γ2 subunits incorporated in that patch. The solid curve represents an interpolation between αβ and αβγ DZ potentiation and Zn2+ block values, modeled using EC50, single-channel conductance, and open probability differences between the two receptor types (Boileau et al., 2005). The open circle lies on the model curve and has error bars corresponding to the 95% confidence intervals (CIs) for DZ potentiation and Zn2+ block (dashed lines). Note that many of the Zn2+ block values for transfections with γ2S ratios below 1:1:10 fall beneath the 95% confidence interval (C, left), whereas transfections varying γ2L ratios do not (C, right).
