
Figure 5.
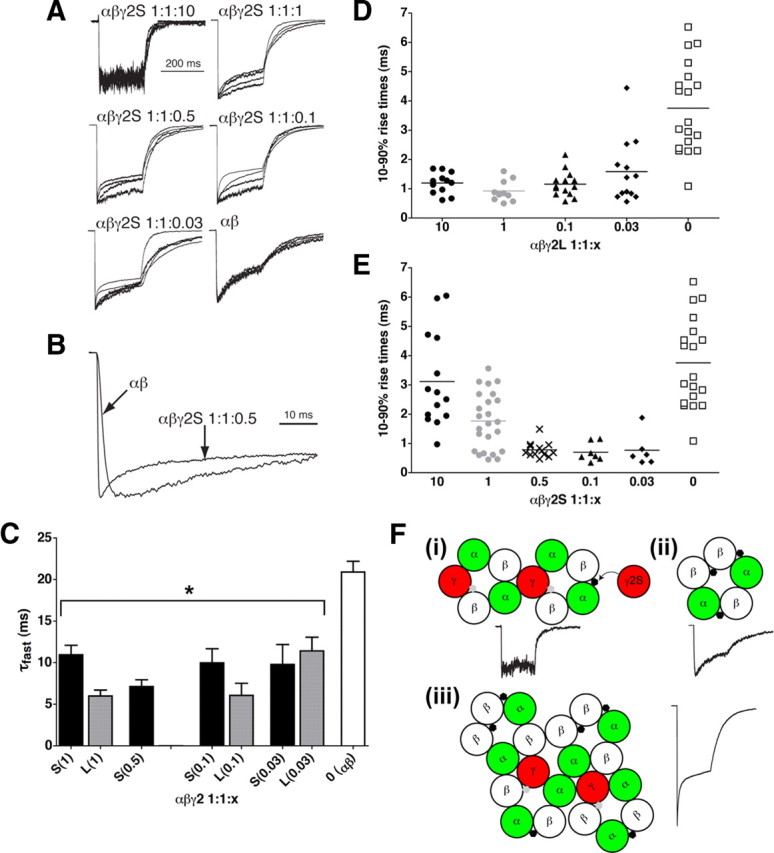
Mixtures of α1β2 and α1β2γ2 receptors exhibit faster kinetics than either pure population but are altered by rogue γ2S subunits. A, Overlaid current traces from four patches each, from α1β2γ2S 1:1:10, 1:1:1, 1:1:0.5, 1:1:0.1, 1:1:0.03, and 1:1:0 (α1β2) transfections, in response to 200 ms pulses of 1 mm GABA. B, Expanded trace comparing fast desensitization in α1β2 receptors with α1β2γ2S 1:1:0.5. Note that the α1β2γ2 1:1:0.5 current is not only faster to desensitize but also faster to rise to peak. C, Plot of fast desensitization time constants (τfast) transfected with α1 and β2 subunits, with varying ratios of γ2S or γ2L subunits, wherein a fast component could be detected. Data are mean ± SEM for n = 17, 6, 13, 8, 3, 6, 7, and 10 patches (left to right). *p < 0.01 compared with α1β2 patches. D, Scatter plot of 10–90% rise times for the cells transfected with α1 and β2 subunits, with varying ratios of γ2L subunits. Note that ratios over a 100-fold range (1:1:0.1 to 1:1:10) give similar rise times for γ2L. E, Scatter plot of 10–90% rise times for αβγ2S transfections in varying ratios. Note that, as γ2S ratio is increased above 0.5, rise times are slowed. F, Models depicting fast desensitization differences between receptors and mixtures. i, α1β2γ2 receptors, possibly clustered, with trace showing no fast desensitization. In the case of γ2S only, rogue γ2S subunits may bind at the α/β interface to cause a slowing of the rise time (compare D with E at 1:1:1 and 1:1:10). ii, α1β2 receptor with fast desensitization. iii, Mixtures of αβ and αβγ receptors may cluster and change kinetic profiles to allow for the ultrafast (7 ms) desensitization time constant. Traces were culled from Figure 1.