
Figure 2.
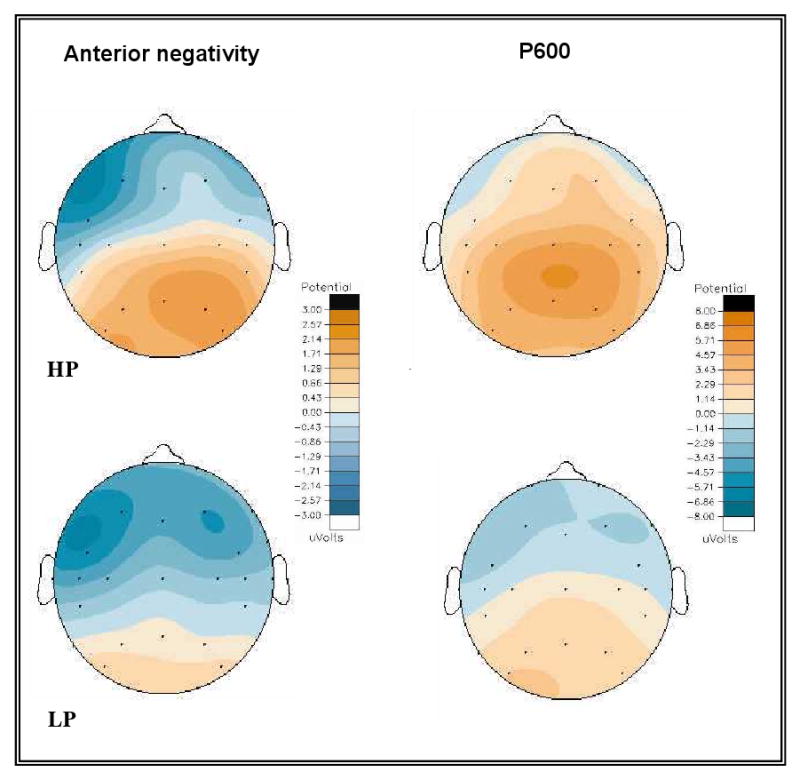
Voltage maps for HP and LP groups illustrating the distribution of the anterior negativity effect for English in over the 100-300 ms time window and the posterior positivity (P600) effect over the 300-1000 ms time window.
Official websites use .gov
A
.gov website belongs to an official
government organization in the United States.
Secure .gov websites use HTTPS
A lock (
) or https:// means you've safely
connected to the .gov website. Share sensitive
information only on official, secure websites.
Voltage maps for HP and LP groups illustrating the distribution of the anterior negativity effect for English in over the 100-300 ms time window and the posterior positivity (P600) effect over the 300-1000 ms time window.