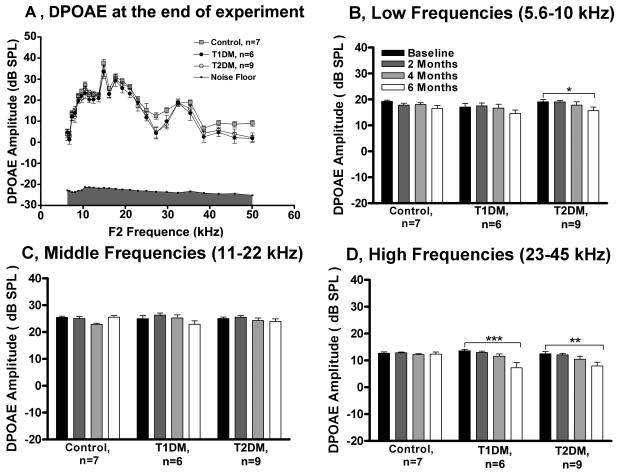
Figure 4.
Diabetes induces drops in DPOAE amplitude levels in middle age CBA/CaJ mice. A) Provides cross sectional data of DPOAE amplitude level as a function of the f2 frequency (kHz) at 6 months. B) Longitudinal data for low frequencies (5.6-10 kHz); C) Middle frequencies (11-22 kHz); and D) High frequencies (23-45 kHz). The two-way repeated-measures ANOVA showed significantly smaller DPOAE amplitudes by 6 months for T2DM at low frequencies, and for both diabetic groups at high frequencies, compared to the starting longitudinal baseline. Data presented as mean ±SEM. * p < 0.05, ** p< 0.01, *** p< 0.001. n, number of mice in each group.

