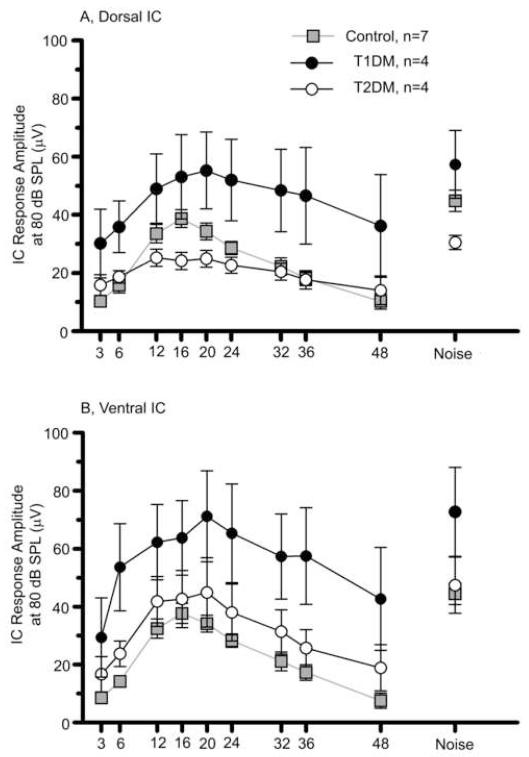
Figure 6.
Diabetes alters intensity coding by elevating responses to broad band noise and tone bursts in the IC at 80 dB SPL. A) Dorsal and B) Ventral IC NFAEP response amplitudes (RMS). T1DM showed higher IC response amplitudes at both locations in the IC, and this difference was statistically significant for experimental groups as determined by a two-way ANOVA (dorsal IC: F= 33.44, p<0.0001, df =2; ventral IC: F=38.47, p<0.0001, df=2). Post hoc Bonferroni tests showed that T1DM was significantly different vs. the control group at 3, 20, 24, 32, 36 and 48 kHz in the ventral IC, and at 36 kHz for dorsal IC. Data presented as mean ±SEM. n, number of mice in each group.

