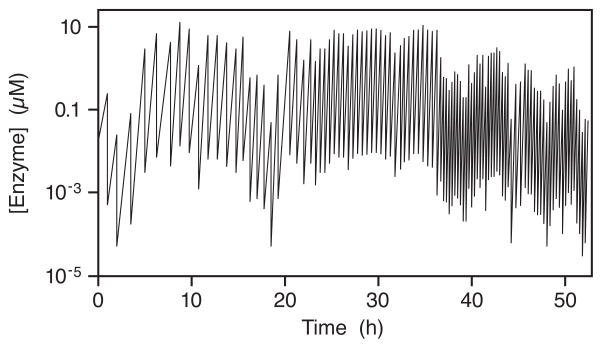
Figure 2.
Time course of continuous evolution of the class I RNA ligase enzyme in a serial transfer experiment involving 100 successive rounds of ~1,000-fold growth and 1,000-fold dilution. The concentration of RNA enzymes was measured before and after each transfer (zigzag line). The time between transfers was decreased as tolerated, initially 1 h and eventually 15 min (figure based on Wright and Joyce 1997).

