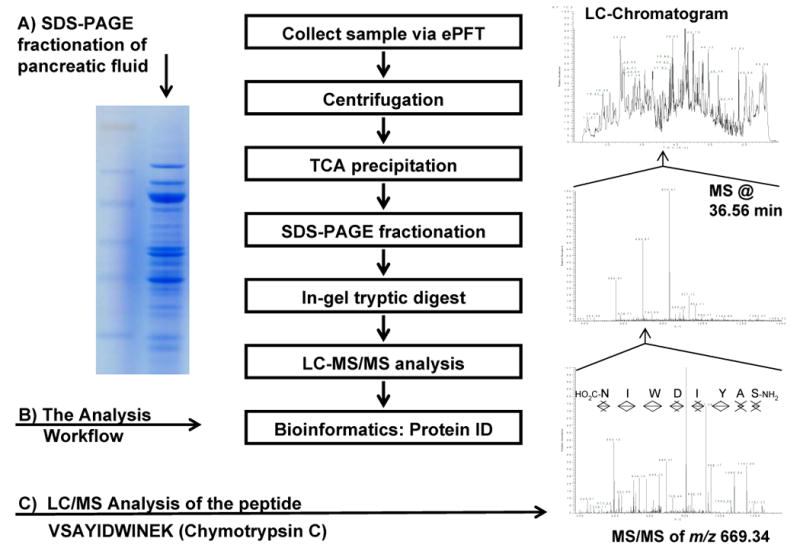
Figure 1.

Experimental workflow. A) SDS-PAGE gel image of proteins extracted from pancreatic fluid. B) Workflow of the GeLC-MS/MS experiment for the proteomic profiling of pancreatic fluid. C) Chromatogram of fraction 11 of the proteomic profiling of pancreatic fluid; the survey mass spectrum at 36.56 min; the product ion spectrum of the peptide at m/z 669.34 (marked with an arrowhead in the survey spectrum); database searches identified this MS/MS spectrum as being from VSAYIDWINEK from chymotrypsin C.
