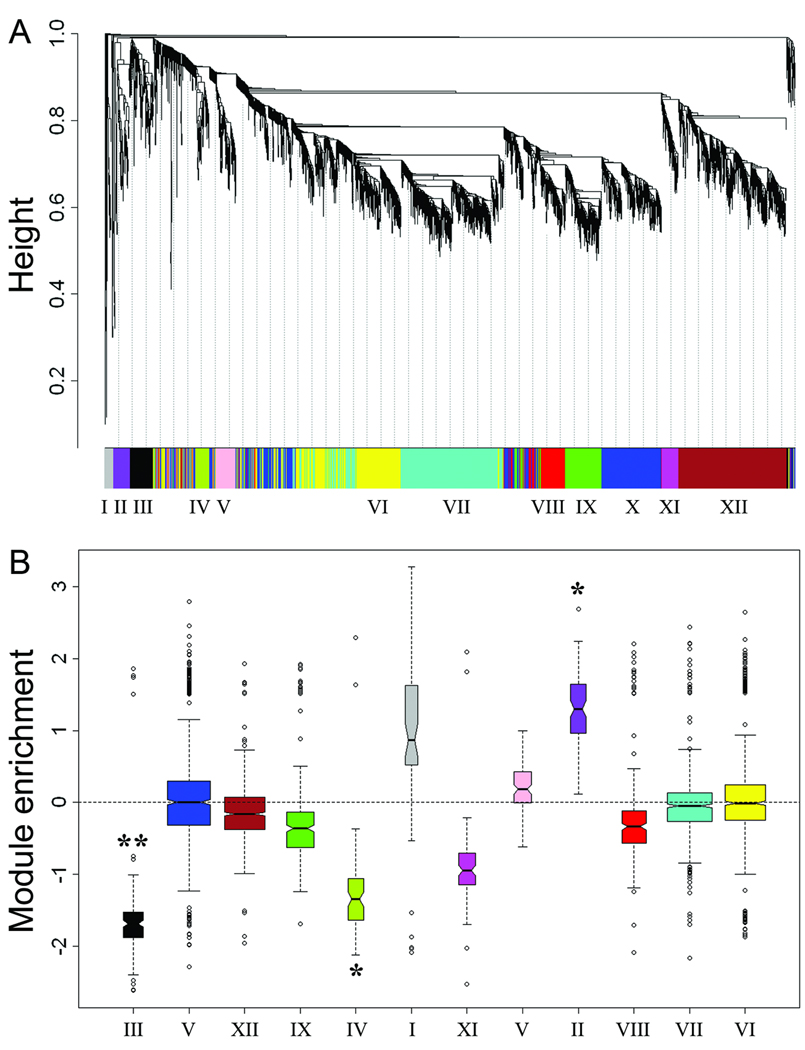
Figure 1. Exacerbation responses are associated with baseline FEV1/FVC ratios.
Gene expression was profiled by microarray in sputum samples obtained during an acute exacerbation from asthmatic children with (n=10) or without (n=10) deficits in enrollment/baseline FEV1/FVC ratios. A: Modules of coexpressed genes were identified by reverse engineering gene network analysis of the microarray data set (n=20). B: The modules were tested for differential expression in responses from subjects with or without deficits in baseline FEV1/FVC ratios. Positive or negative values on the vertical axis indicate that a module is enriched with genes that are increased or decreased respectively (based on gene-level Bayesian t.test statistics25) in responses from subjects with deficits in FEV1/FVC ratios as compared with those with normal FEV1/FVC ratios. The p-values are derived from a statistical analysis at the module-level utilizing the Gene Set Analysis test without adjustment for multiple testing.29 ** p-value < 0.01; * p-value < 0.05.

