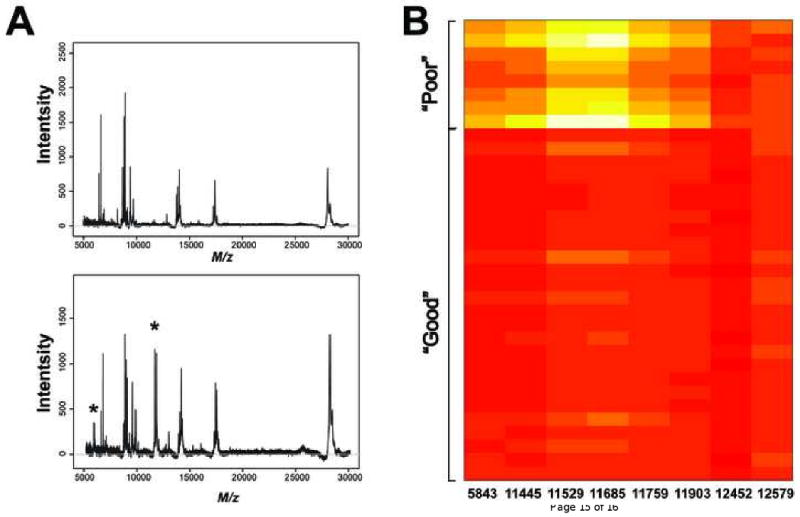
Figure 1.

(A) Representative spectra from a patient classified as “good” (upper panel) versus another patient who was classified as “poor”. A peak around 6000 Da and another cluster of peaks in the 11000 to 12000 Da range are observed in the spectrum from a patient who was classified as “poor”. (B) A heatmap is used to visually summarize peak intensities of the eight peaks in the VeriStrat algorithm from the cohort treated with bevacizumab and erlotinib. Differences can be observed between the patients who were classified as “poor” and those who were classified as “good”.
