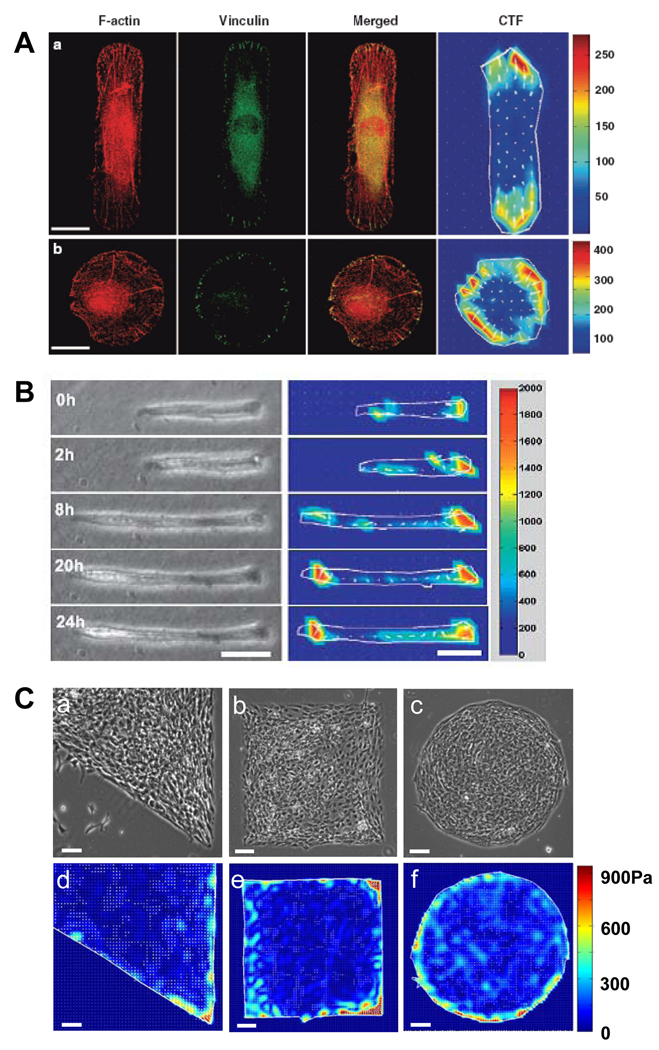
Figure 5.
CTFM for micropatterned cells. (A). Application of CTFM to determine traction forces of micropatterned cells. Immunofluorescence microscopy images of F-actin, vinculin, and their overlay, as well as CTFs in micropatterned HPTFs. a, rectangular HPTF; b, circular HTF. Development of focal adhesions and stress fibers is seen to be closely related to cell traction force distribution. Scale bars, 20 µm. (Adapted with permission from Fig. 6 in Li et al., Cell Motil Cytoskeleton 65: 332, 2008). (B). Traction force development of micropatterned C2C12 cells during differentiation. Phase contrast images (left panel) and corresponding traction force maps (right panel), respectively. The color bar represents traction force level. Scale bars, 50 µm. (Reproduced with permission from Fig. 5 in Li et al., J Biomech 41: 3349, 2008). (C). Mechanical stress distribution of patterned cell aggregates. a–c, micropatterned cell islands of distinctive shapes. d–f. CTF distribution of cell islands determined by CTFM. Scale bars, 100 µm. (Adapted with permission from Fig. 2 in Li et al., J Biomech 42: 1622, 2009).

