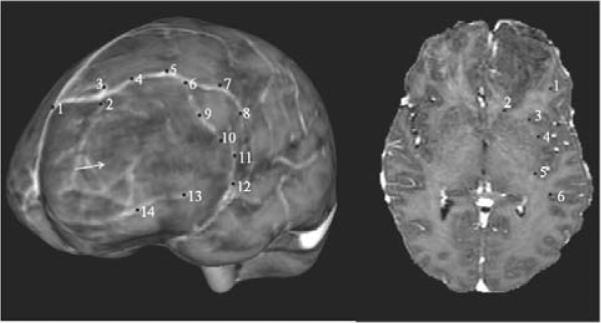
Figure 4.

Surface (left) and sub-surface (right) points for Patient 1 that were used in the model. The arrow in the surface point distribution figure (left) points to the location of the tumor. Sub-surface points 1 and 2 are located superior (at a higher elevation) to the tumor, points 3,4 and 5 were located in plane with the tumor and point 6 is located inferior to the tumor. Surface points were used to constrain the linear inverse model and sub-surface points were used to validate the accuracy of the model. Though the same numbering scheme has been used in both halves of the figure, it should be noted that the points in the left-hand side do not correspond to the points in the right-hand side.
