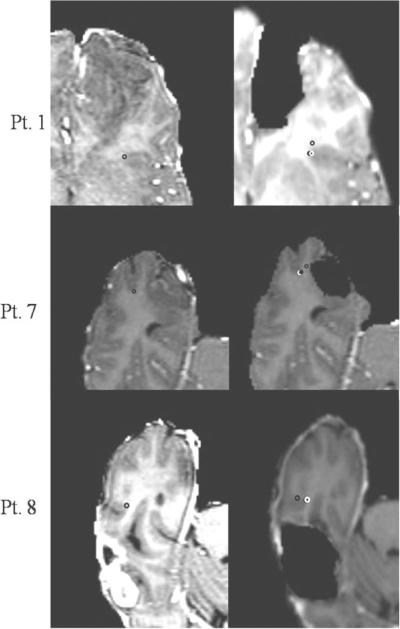
Figure 7.
Image updating results for a sub-surface point chosen in Patients 1,7 and 8. Column 1: Sub-surface point (shown as a hollow black circle) in the patient's pre-op image. Column 2: Hollow black circle shows the same point in the patient's post-op image before brain shift. Solid black circle shows the “true” shifted position of the point and the white hollow circle shows the predicted shifted position of the point. True shift here refers to the shift measured using the registered pre-op and post-op point. Measured/True shift for patient 1: 5.5mm, Predicted shift: 4.5mm. Measured shift and Predicted shift for Patient 7: 4mm and 3.2 mm respectively. Measured shift and predicted shift for patient 8: 5.1mm and 4.2mm respectively.

