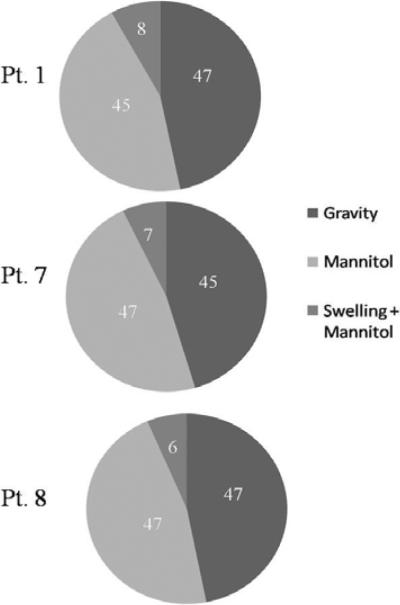
Figure 8.

Distribution of regression coefficients for Patients 1, 7 and 8. Atlas IV (concatenated deformation atlas) was used to generate these charts. Though only three patients have been shown here, a similar distribution was observed for all eight patients reported in this study.
