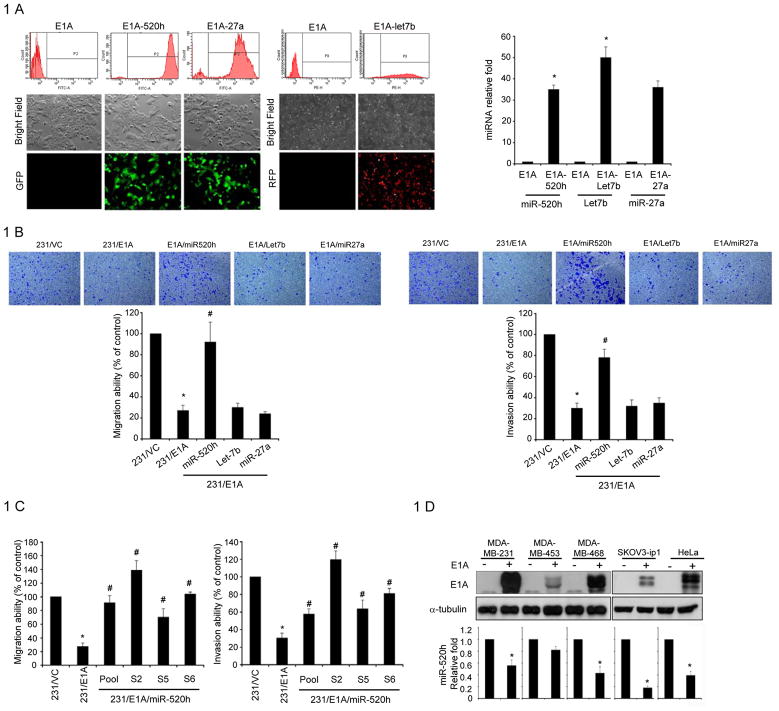
Figure 1. E1A-mediated Regulation of miRNA in Human Cancer Cells.
A, left, the expression of miR-520h, miR-27a (GFP+ cells) and let-7b (RFP+ cells) accounted for over 90% of transfected cells, as determined by fluorescence-activated cell sorting (FACS) analysis, and were used for further migration or invasion study. right: After miRNA transfection, RNA was isolated from MDA-MB-231/E1A transfected cells and the expression of miRNAs was confirmed by qRT-PCR. The data were normalized to the level of U47 RNA in each sample. Error bars indicate SD. The asterisk indicates a significant difference (P<0.05) between 231/E1A and miRNA transfected 231/E1A cells. B, transwell migration assay and matrigel invasion assay of MDA-MB-231/E1A cells transfected with different miRNA expression vectors, miR-520h, let-7b and miR-27a. Bars indicate the migration or invasion activity compared to that of 231/VC± SD. Each assay was performed in three independent experiments. The asterisk indicates a significant difference (P<0.05) between 231/VC and 231/E1A cells. E1A-dependent migration and invasion ability suppression was overturned by miR-520h to a significant degree, as indicated by the # symbol (P<0.05). C, transwell migration assay (left) and matrigel invasion assay (right) of MDA-MB-231/E1A cells with different stable miR-520 expressing transfectants (231/E1A/miR-520h). Bars indicate the migration or invasion activity compared to 231/VC ± SD. Each assay was performed in three independent experiments. The asterisk indicates a significant difference (P<0.05) between 231/VC and 231/E1A cells. E1A-dependent migration and invasion suppression was overturned by expression of miR-520h, as indicated by the # symbol (P<0.05). D, different cancer cells were transfected with E1A. Upper, 48 hours after transfection, E1A expression was confirmed by western-blotting. Bottom, RNA was isolated from transfectants to determine the expression level of miR-520h by qRT-PCR. The data were normalized to the level of U47 RNA in each sample. Error bars indicate SD. The asterisk indicates a significant difference (P<0.05) between E1A transfected and control cells; P-values based on a one-tailed Student’s t-test.

