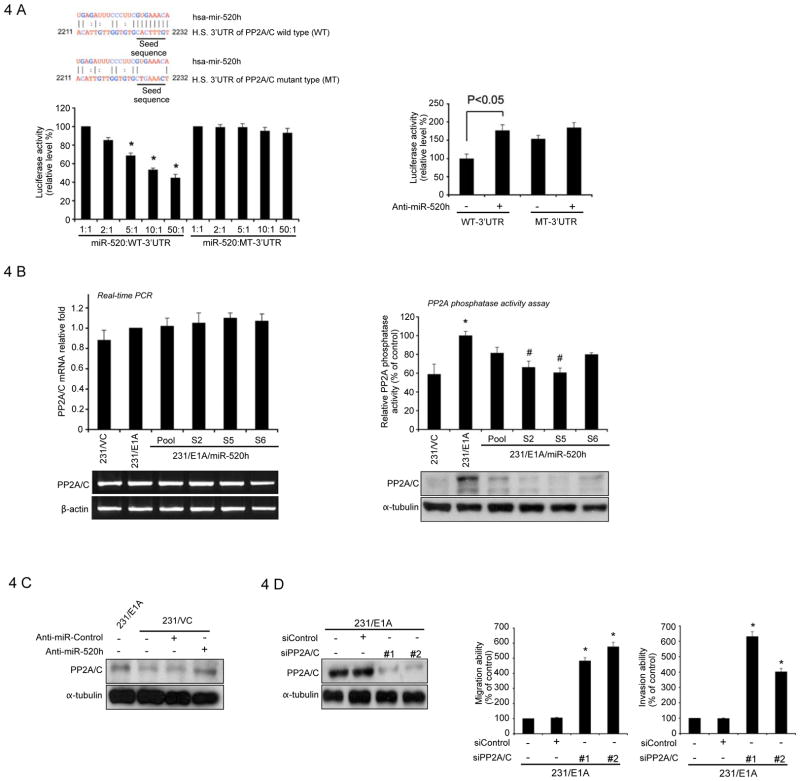
Figure 4. Direct Downregulation of PP2A/C by miR-520h.
A, left, upper, a schematic diagram represents the predicted miR-520h binding sequences or mutated versions. Lower panel, luciferase activity of DNA constructs carrying the wild-type PP2A/C 3′UTR (WT-3′UTR) or mutated-type PP2A/C 3′UTR (MT-3′UTR) downstream of the luciferase reporter. 293T cells were cotransfected with WT-3′UTR or mutant MT-3′UTR reporter (carrying the luciferase-PP2A/C-3′UTR chimera) and a plasmid expressing miR-520h at different ratios. miR-520h reduced luciferase activity in transfectant with wild-type (WT-3′UTR), but not with mutant (MT-3′UTR), reporter in a dose-dependent manner. Luciferase activity was normalized for transfection efficiency as indicated in the experimental procedures. Data are shown as separate assays at five different luciferase/miRNA ratios as indicated. Bars indicate Firefly/Renilla luciferase activity ratios that are normalized to the activity ratio (1:1) of 293T transfected with WT-3′UTR reporter or MT-3′UTR and miR-520h. Data are shown as three independent assays, and each sample was assayed in triplicate. Error bars represent SD. The asterisk indicates a significant difference (P<0.05) between miR-520h transfected different ratio (5:1, 10:1, 50:1) and control ratio (1:1) cells. Right, cotransfection with the inhibitor for miR-520h (anti-mir-520h) increased PP2A/C WT-3′UTR luciferase expression but not PP2A/C MT-3′UTR luciferase expression in 231/VC cells. Bars indicate Firefly/Renilla luciferase activity ratios normalized to that of 231/VC transfected with WT-3′UTR reporter. Data are shown as three independent assays, and each sample was assayed in triplicate. Error bars represent SD. P-value based on one-tailed Student\s t-test. B, left, upper, expression of PP2A/C mRNA in stable clones of 231/VC, 231/E1A, and different 231/E1A/miR-520h by qRT-PCR. Data were normalized to the level of GAPDH mRNA. Bottom, RT-PCR results of PP2A/C mRNA expression in 231/VC, 231/E1A and different stable clones of 231/E1A-miR-520h. β-actin served as the internal control. Right, upper, assay of PP2A/C phosphatase activities in stable clones of 231/VC, 231/E1A, and different 231/E1A/miR-520h. Bars indicate the phosphatase activity normalized to that of 231/E1A ± SD. The asterisk indicates a significant difference (P<0.05) between 231/VC and 231/E1A cells. E1A-dependent PP2A/C activity induction was overturned by miR-520h to a significant degree, as indicated by the # symbol (P<0.05). Bottom, immunoblotting of PP2A/C in stable clones of MDA-MB-231/VC, 231/E1A, and different 231/E1A/miR-520h. C, whole cell extracts of MDA-MB-231 cells transfected with the miR-520h inhibitor (anti-miR-520h) or non-target sequence control inhibitor (anti-miR-control) were prepared 48 hours after transfection and analyzed by immunoblotting with PP2A/C and tubulin antibodies. D, left, 231/E1A cells stably transduced with different sequences of siRNA that specifically target to PP2A/C (siPP2A/C) and analyzed by immunoblotting with PP2A/C and tubulin antibodies. Middle and right, transwell migration assay (middle) and matrigel invasion assay (right) of 231/E1A cells stably transduced with different sequences of siRNA that specifically target to PP2A/C (siPP2A/C). Bars indicate the migration or invasion activity in compare with 231/E1A ± SD. The asterisk indicates a significant difference (P<0.05) between siPP2A/C- and siControl-transduced 231/E1A cells.

